
关于“client push”应用响应时间测量方法的讨论
作者:易隐者 发布于:2012-4-28 9:27 Saturday 分类:网络分析
在我们分析业务系统故障时,经常会涉及到应用响应时间的测量和分析,有很多网络分析产品都有对应用响应时间的统计测量,比如siniffer,netscout等,不同的产品对应用响应时间测量的方法应用有所差别,前段时间正好看到netscout关于应用响应时间测量的白皮书,里面提到了clinet pull与client push两种常见的基于TCP的应用响应时间测量方法,我在这篇文档中,针对netscout的client push的应用响应时间测量的方法提出了一些改进的建议,这个建议是拿来让大家讨论的,暂且不管这个改进建议在实际统计测量中的可行性,如果能够通过我的这篇文档,能够让大家对应用响应时间测量的方法有跟深入的认识,那么,我的目的就达到了。
1 Netscout应用响应时间测量的方法
在netscout的白皮书《Using nGenius to Measure Application Responsiveness》中,对应用响应时间的测量方法做了如下的描述:
Algorithms used by URT:
全局响应时间算法:
For http applications (identified by specific URLs), the response time is measured by the time it takes to complete an “HTTP GET” request. Note that this is not the same as the “web page download” time which will typically involve multiple GET requests. For redirected requests, the response is considered complete when the redirected path is returned as the initial response to the GET request.
对于HTTP应用(通过特定的URLS来定位),响应时间通过一个完整http get 请求时间来测量。需要指出的是,这个不同于web页面下载时间,因为web页面下载时间包含多个get请求。对于重定向请求,其响应时间是按照从get请求至重定向路径完全返回的时间。
For TCP applications the connect time is measured by observing the SYN, SYN-ACK, ACK connect sequence. This is considered to be representative of round trip network latency and is reported using “TCP” as the application ID. In the recommended single probe scenario, in which the probe is located near the server, the application- specific response time is considered to be a server responsiveness metric, excluding network latency. In this case, total response time = server responsiveness + network latency.
对于TCP应用,其连接时间通过发现SYN, SYN-ACK, ACK连接序列来测量。这个时间一般可以代表网络往返延时。在单一探针部署的场景中,探针部署的位置位于服务器附近,此时的应用响应时间主要指服务器响应,不包括网络延时,在这种情况下,整体响应时间=服务器响应+网络延时
When calculating response times, the following rules apply: The server is identified as the entity which owns the “well-known” or the “application” TCP port and is independent of who issues the initial SYN or TCPconnect request. The reported response time is the difference between the timestamps signifying the end of a TCP transaction and the start of a TCP transaction. In most cases, the Client is either pushing data to a server or pulling data from a server. Note that a FIN can contain data and may count as a data packet.
The case when the server is simply pushing data (e.g. FTP GET) to the client is not interesting (and hence not handled), as that would simply measure client responsiveness.
Client Push Example:
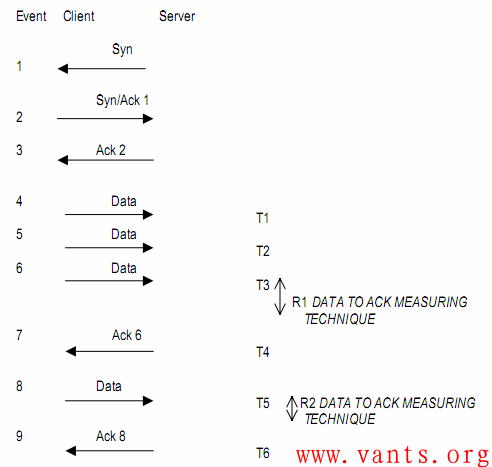
When a client is pushing data to a server, every client packet contains data (more than 0 bytes in the TCP payload) and no server packets contain data. The transaction starts when the probe sees a client data packet (T3 & T5 in the illustration below). The transaction ends when the probe sees a TCP ACK coming from the server that covers all of the data in the client packet (T4 & T6 in the illustration). An example for “Client Push” is FTP PUT.
Client Pull Example:
When a client is pulling data from a server, data coming from the client is considered a request. Subsequent data coming from the server is considered a response. A transaction starts when the probe sees a client data packet (T1 & T3 in the illustration). The transaction ends when the probe sees that the server has ACK’d all of the data in the request and responded with its own data packet (T2 & T4). Examples for “Client Pull” include HTTP GET and many custom TCP applications.

By analyzing the TCP flow the probe may continually transition between measuring for a client pull and measuring for a client push. The amount of time that the probe will wait for data from the server before assuming it is not in a client pull scenario can be fine tuned to yield the best results for the protocol.
Handling Anomalies:
These new rules for measuring responsiveness are quite different from the one used in NetScout’s previous ARTMIB implementation. They have been revised to yield more useful results in most cases. However, there are circumstances that may offer misleading results. They tend to introduce outliers in the response time distribution that may result in poor response time averages. These circumstances are often associated with applications when the TCP transport is utilized in non-traditional ways, like for sending keep-alive messages and for tunneling (like NetBIOS) etc. The response time measurement algorithm attempts to remove such outliers from the response time distribution on a best effort basis.
大体意思就是netexpert上sonicant描述的:
一是 Client Pull,即客户端从服务器端取数据,也称为Data-to-Data Measuring(数据到数据测量):
当客户端从服务器端请求数据的时候,从客户端发来的数据包符合:SYN+非零payload,被认为是一次请求。probe检测到这个包(T1)后即开始响应时间测量。服务器随后发出的ACK并不会结束这次测量,而是当probe检测到服务器端发出第一个带payload的数据包(T2)才结束。而如果服务器端直接回应带payload的ACK,则probe会识别并以此结束这一次响应时间的测量。
二是Client Push,即客户端向服务器端发送数据,也称Data-to-ACK Measuring (数据到ACK测量):
当客户端向服务器发送数据的时候,每个客户端到服务器的包都包含数据(非零payload);然而,服务器回应的ACK不包含数据。probe从看到客户端的数据包开始测量响应时间,当probe看到服务器将之前客户端传的数据包都ACK完后,终止这次测量。
2 netscout Client Push应用响应时间测量方法不合理的地方及其改进建议
在客户端向服务器端发送数据的时候,实际应用中,存在两种可能,一种是服务器端在收到客户端的数据,应用进程处理完毕后,需要向客户端发送响应数据;另外一种情况是服务器端接收并处理来自客户端的数据,但是应用进程并不会发送响应数据给客户端。我们分别来分析一下这两种情况下的应用响应时间的测量问题。
2.1 应用进程有应用数据响应的情况:
应用进程需要发送响应数据给客户端,那么站在网络数据交互的角度,真正能够反映应用响应时间的,是服务器端接收到客户端发送的数据至服务器端发出应用进程响应数据的时间间隔。
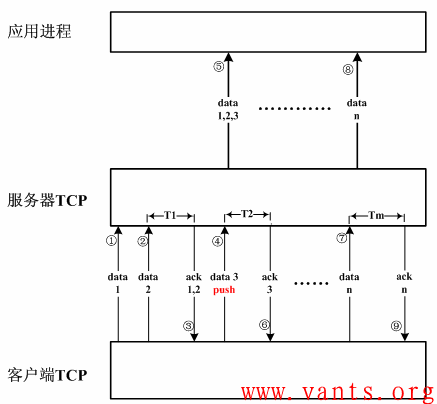
我们先看一下下面图示的中客户端与服务器以及服务器与应用进程间数据交互的过程:
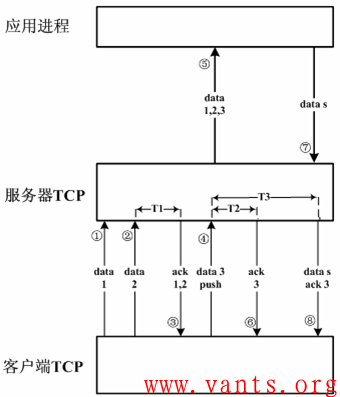
客户端与服务器以及服务器TCP与应用进程数据交互的过程说明:
1,客户端向服务器发送data1、data2(数据包①、②);
2,data1、data2进入服务器端TCP缓存,服务器端对data1、data2进行ack确认(数据包③);
3,客户端向服务器端发送data3,并且PUSH标志位置1(数据包④);
4,服务器端立即将TCP缓存中的data1、data2连同data3一起递交给应用进程(数据⑤),同时对data3进行ack确认(数据包⑥);
5,应用进程处理完客户端的数据之后,发送应用层响应数据data s(数据⑦);
6,服务器TCP层封装data s,发往客户端(数据包⑧)。
在这个交互的过程中,如果按照netscout的算法,可以计算出应用响应时间应该是T1、T2两个值,但是,实际中,T3才是真正的应用进程针对客户端上传数据的响应时间。
接下来,我们再看一个实际环境中的案例,下图为一个HTTP应用“POST”操作时客户端与服务器端的数据交互过程图示:
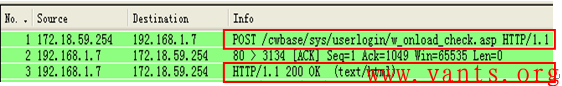
客户端通过一个post命令,向服务器端提交了部分应用数据,服务器端应用进程在处理完这些应用数据之后,会做出一些应用层响应(http/1.1 200 ok)。
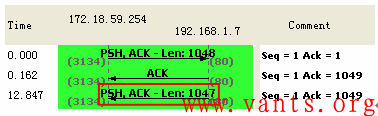
在这种情况之下,如果按照netscout的算法,应用响应时间应该是0.162秒,但是,在实际交互过程中,我们都知道,真正的应用响应时间应该是12.847秒。
另外,我们再看一下局域网打印文件的数据交互过程:
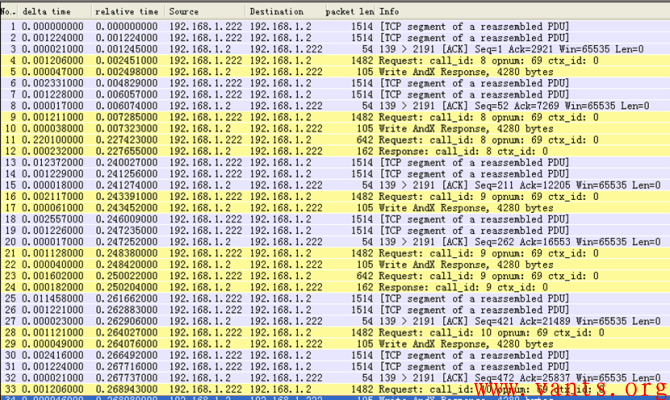
分析这个局域网共享打印数据包的交互过程:
1,第一、第二个数据包为客户端192.168.1.222向打印服务器192.168.1.2上传的数据;
2,第三个数据包为打印服务器1.2对1.222的确认,无应用层数据;
3,第四个数据包为客户端1.222向打印服务器192.168.1.2上传的数据;
4,第五个数据包为服务器1.2对1.222的应用层响应数据。
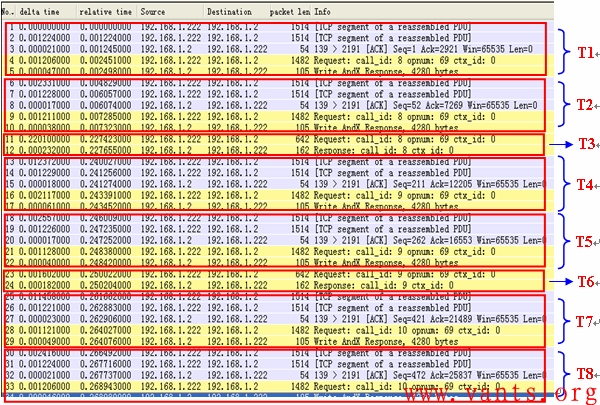
分析这个过程,我们可以发现,按照netscout的算法,应用响应时间为第二个包与第三个包的时间差值;实际的响应时间应该是第五个数据包与第二个数据包间的时间差值。同理,可以测出响应时间T2至T8,如下图所示:
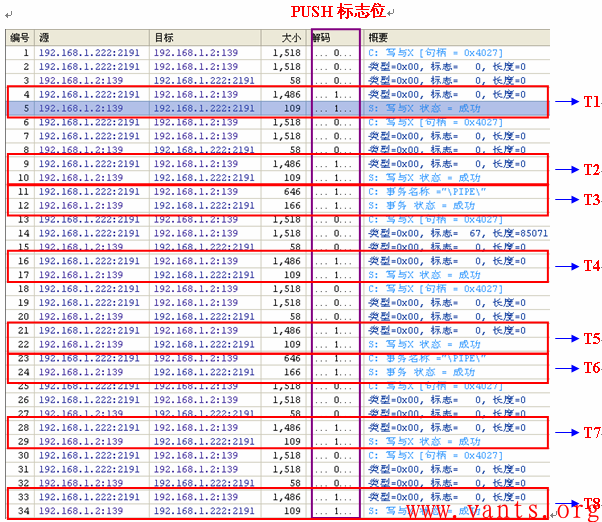
应用数据在交互的过程中,客户端向服务器发送的数据一般不直接递交给服务器端的应用进程,而是先存放在服务器端的TCP缓存中,这些数据在没有递交给应用进程之前,服务器端的TCP层面的响应根本无法反映出应用程序的响应时间。应用响应时间应该是在应用进程已经接受到客户端的应用数据之后,处理完再发出应用层响应数据的时间。那么我们如何才能够更加精确的测量应用响应时间呢?我们都知道,在TCP协议里,有一个PUSH标志位,这个标志位的作用就是告之接收端将接收到的应用数据连同TCP缓存中的数据立即递交给应用进程处理。那么,我们就可以在实际的TCP应用数据交互中,使用如下的方法对pull操作的应用响应时间进行测量:
从客户端带有PUSH标志位的数据包开始计算,至服务器端响应应用层数据停止计算。我们还以2.1章节里的局域网共享打印服务交互的数据为例,经过优化的应用响应时间计算应该如下图所示:
2.2 应用进程无应用数据响应的情况:
在客户端向服务器发送数据时,如果服务器端应用进程不响应应用层数据,那么服务端仅仅只在TCP层面响应客户端数据的ACK,那么按照netscout的测量方法计算得到的不是应用的响应时间,而是系统的响应时间。我们来看一下下面图示的数据交互过程:
我们先看一下客户端与服务器端以及服务器端TCP与应用进程间的数据交互过程:
1,客户端向服务器发送data1、data2(数据包①、②);
2,data1、data2进入服务器端TCP缓存,服务器端对data1、data2进行ack确认(数据包③);
3,客户端向服务器端发送data3,并且PUSH标志位置1(数据包④);
4,服务器端立即将TCP缓存中的data1、data2连同data3一起递交给应用进程(数据⑤),同时对data3进行ack确认(数据包⑥);
5,客户端向服务器发送data n(数据包⑦),服务器端将data n递交给应用进程(数据⑧),同时对data n进行ack确认(数据包⑨)。
在这个过程中,按照netscout的响应时间计算方法,得到的应用响应时间应该是T1、T2、Tm,但是,这些时间值基本上只能算是服务器端系统的响应时间,不能算作是应用进程处理的响应时间,因为站在网络数据交互的角度,根本就没看到应用进程的应用响应数据。
以FTP上传文件为例,我们来看一下这个应用的数据交互情况:
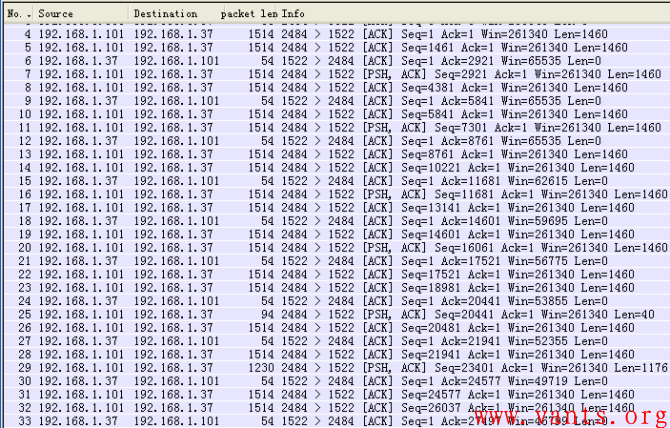
FTP PUT部分数据包交互情况示意图
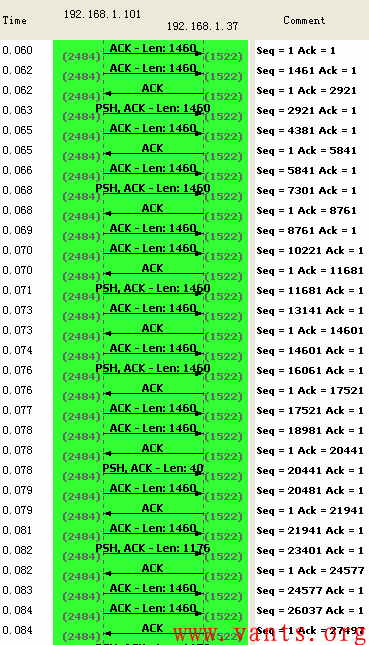
FTP PUT操作的部分数据交互流程图
在这个应用交互的过程中,我们可以看到,应用进程一直没有给客户端响应数据,所有的ack都是来自服务器端系统,在数据包交互的过程中,根本看不出应用进程的响应时间,但是如果按照netscout的计算方法,在这里能够计算出一堆的应用响应时间出来。
既然无应用数据响应,那么就说明站在网络数据交互的角度,无法测量应用程序的响应时间,即使测量了,也无法真正反映应用程序的响应时间,那么就没有测量的必要了。
标签: Netscout 响应时间 应用响应时间 ART get push client push
版权所有:《蚂蚁网-多维人生,三实而立!》 => 《关于“client push”应用响应时间测量方法的讨论》
本文地址:http://www.vants.org/?post=30
除非注明,文章均为 《蚂蚁网-多维人生,三实而立!》 原创,欢迎转载!转载请注明本文地址,谢谢。
评论:
-
QQ邮箱订阅

-
搜索
日历
最新日志
链接
分类

最新碎语
- 如果一个人想要做一件真正忠于自己内心的事情,那么往往只能一个人独自去做"——理查德·耶茨
2019-06-25 21:34
- 日后我们知道,真正的人生道路是由内心决定的。不论我们的道路看上去如此曲折、如此荒谬地背离我们的愿望,它终归还是把我们引到我们看不见的目的地。(茨威格《昨日世界》)
2019-03-16 21:27
- 如果你渴望得到某样东西,你得让它自由,如果它回到你身边,它就是属于你的,如果它不会回来,你就从未拥有过它。——大仲马《基督山伯爵》
2018-10-09 22:07
- 人生有两大悲剧:一个是没有得到你心爱的东西;另一个是得到了你心爱的东西。人生有两大快乐:一个是没有得到你心爱的东西,于是可以寻求和创造;另一个是得到了你心爱的东西,于是可以去品味和体验。——弗洛伊德
2018-09-25 18:06
- 一个人越有思想,发现有个性的人就越多。普通人是看不出人与人之间的差别的——布莱兹·帕斯卡尔
2018-08-30 18:44
存档
- 2020年11月(2)
- 2018年1月(1)
- 2017年12月(1)
- 2017年11月(6)
- 2017年6月(1)
- 2017年5月(1)
- 2017年4月(1)
- 2017年3月(1)
- 2016年11月(1)
- 2016年4月(1)
- 2015年7月(2)
- 2015年6月(1)
- 2015年5月(5)
- 2014年12月(1)
- 2014年11月(1)
- 2014年10月(1)
- 2014年8月(1)
- 2014年7月(1)
- 2014年6月(1)
- 2014年5月(1)
- 2014年4月(3)
- 2014年2月(2)
- 2014年1月(2)
- 2013年12月(1)
- 2013年11月(1)
- 2013年10月(2)
- 2013年9月(1)
- 2013年8月(1)
- 2013年7月(3)
- 2013年6月(2)
- 2013年5月(1)
- 2013年4月(3)
- 2013年3月(1)
- 2013年2月(2)
- 2013年1月(2)
- 2012年12月(11)
- 2012年11月(12)
- 2012年10月(12)
- 2012年9月(26)
- 2012年8月(29)
- 2012年7月(18)
- 2012年6月(2)
- 2012年5月(25)
- 2012年4月(16)
- 2012年3月(13)
- 2012年2月(6)
标签
blogger

2012-06-13 07:43
<a href=http://buypriligygeneric.net/>priligy purchase</a> priligy no prescription
<a href=http://comprarviagra-generico.net/>generico viagra</a> viagra
<a href=http://achat-viagra-generique.net/>viagra medicament</a> commander viagra france
<a href=http://comprareviagra-generico.net/>viagra</a> prezzo viagra 50 mg