A10负载均衡抓包方法
作者:易隐者 发布于:2012-3-26 22:53 Monday 分类:参考资料
1,登录方式
(1)Console方式设置说明
COM的参数设置如下图所示:

AX的默认用户名为:admin,默认密码为:a10。
(2)SSH/Telnet方式登录说明
AX的MGMT接口的默认IP地址为:172.31.31.31/24。将PC的IP地址配置为与AX的MGMT接口同网段的地址(如:172.31.31.33/24)。采用SSH客户端软件(如:PuTTY)等访问AX的MGMT接口地址。
CLI命令行模式说明
AX采用类似Cisco的命令行模式,便于工程师操作和维护。
1) 当通过SSH客户端软件或远程终端软件登录AX时,并输入用户认证信息后,则进入AX的用户模式:
2)
jjwxc-2>
3) 在用户模式下,AX只允许使用一些基本的命令,查询状态基本信息。具体可使用的命令列表可通过“?”来查询。
jjwxc-2>?
axdebug AX Debug Commands
enable Turn on privileged commands
exit Exit from exec
help Description of the Interactive Help System
no Negate a command or set its defaults
ping Send ICMP echo messages
show Show Running System Information
ssh Open an ssh connection
telnet Open a telnet connection
traceroute Trace route to destination
Debug抓包分析命令
抓包命令设置如下:
(1)首先设置过滤条件:
Debug packet [ l3 ip <clientip vip or serverip> ] [ l4 TCP/UDP port 端口号 ]
(2)启用抓包输入
Debug monitor
(3)分析抓包输出结果
(4)结束抓包输入:
No debug all
中新金盾抗拒绝服务系统抓包方法
作者:易隐者 发布于:2012-3-21 20:23 Wednesday 分类:参考资料
1,登录
在浏览器地址栏输入http://192.168.107.1:28099,进入金盾抗拒绝服务系统登陆页面(具体需要看设备的管理口接入情况,本章管理地址为192.168.107.1)。登录页面如下图所示:
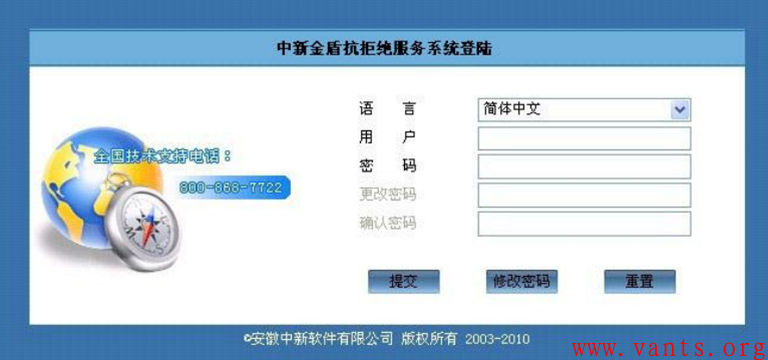
输入管理用户名和密码,并点击“提交”,即可进入设备欢迎页面。如果密码不正确,将进入验证失败页面,此时需返回并重新输入密码。
注:金盾抗拒绝服务系统出厂默认用户名为:admin 密码为:123,请登陆设备后第一时间更改为复杂密码(推荐包含字母、数字、符号的任意组合)。
2,抓包
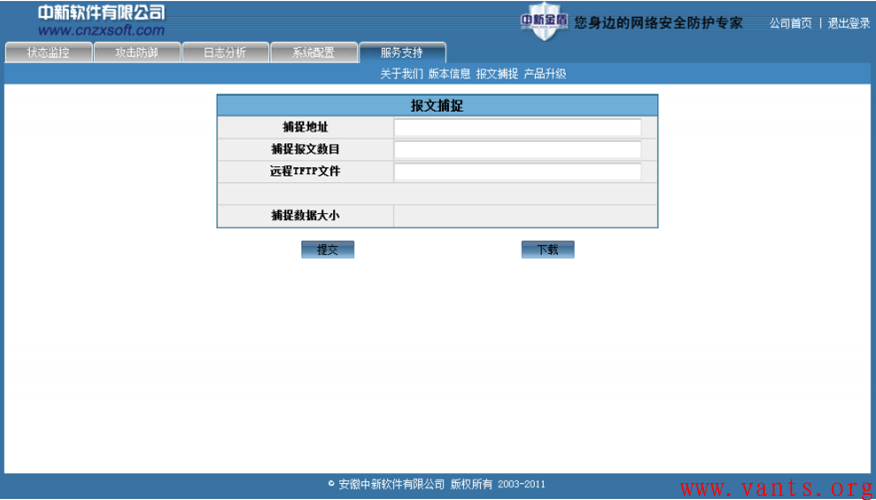
1)捕捉地址
可通过输入指定地址来进行数据捕捉,如为空表示全局报文捕捉,也可以设置为指定IP 表示捕捉单一地址的报文数据。
2)捕捉报文数目
通过设置数据来决定捕捉报文的大小。
3)捕捉数据大小
设置捕捉地址和数目后提交,会在此处显示已捕捉到的数据大小,是流量单位显示。
4)提交/下载
“提交”表示开始报文捕捉;“下载”可将捕捉到的报文数据下载到指定路径。
Bluecoat加速网关抓包方法
作者:易隐者 发布于:2012-3-19 20:52 Monday 分类:参考资料
图形界面
可通过图形界面到maintenance-〉Service information-〉Packet capture,从右边的界面中点击Start capture来开始抓包,stop capture来停止抓包。Download可以将所抓的包下载到本地使用wireshark工具进行分析。注意SG抓包最多能存100MB的包。
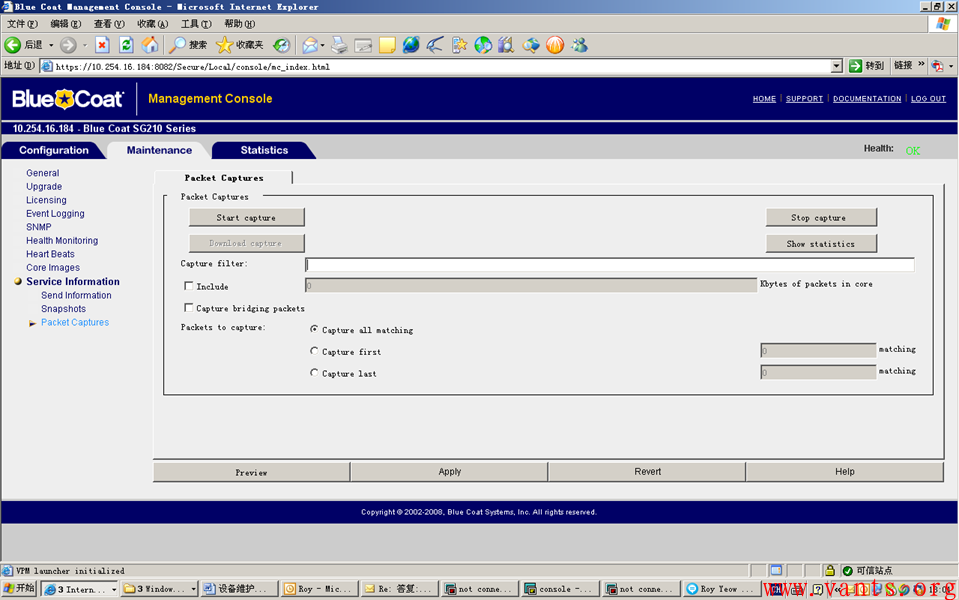
如果通过SG的流量过大,可采用capture filter来进行抓包过滤,bluecoat的抓包filter的写法遵循TCPDump。
命令行界面
You can take a packet capture from Bluecoat Director using the following commands from the Director CLI:
Login to director
Go into Enable Mode
director# config t
director (config) # tcpdump filter -s0 (NOTE: This sets the number of bytes to capture per packet; -s0 captures a full packet
director (config) # tcpdump start
director #
tcpdump: listening on eth0, link-type EN10MB (Ethernet), capture size 96 bytes
director (config) # tcpdump stop
ok
231 packets captured
231 packets received by filter
0 packets dropped by kernel
You can upload the packet capture to a server for viewing purposes using the following command:
director # tcpdump upload ftp:/// / username password
director #
Packet captures taken from director can be viewed by Wireshark (http://www.wireshark.org).
标签: wireshark tcpdump 抓包 Bluecoat 加速网关
Radware负载均衡抓包方法
作者:易隐者 发布于:2012-3-16 17:51 Friday 分类:参考资料
Radware负载均衡下主要利用tcpdump抓包,我从其相关资料中找到如下描述,大家可参考:
TCPDUMP
You can use tcpdump on any AppXcel interface. You can output the dump to the CLI prompt or export it to a file (over zmodem or SSH).
Use the following tcpdump commands at the prompt:
• system tcpdump print [-t <time-out (sec)>] [-c <max number of packets>] [-s <size>]
Displays the TCP dump at the prompt. The information is continuously printed to the screen until the collection time-out is over.
• system tcpdump export [-t <time-out (sec)>] [-c <max number of packets>] [-s <size>]
Exports the TCP dump information to a text file. Information is saved in the file until the collection time-out is over.
where:
• -t is the period for the TCP dump to collect data. Default: 60 seconds.
• -c is the maximum number of packets to collect. Default: 10000 packets.
• -s is the maximum packet length to be captured. Default: 0 (capture whole packet).
It is possible to apply traffic filters to the dump. AppXcel uses the Ethereal format of expressions. For a complete description refer to
http://www.ethereal.com/docs/man-pages/tcpdump.8.html.
Examples: Commonly used filters
A To filter by destination IP, enter and the IP. To filter by source IP, enter src host and the IP.
B To filter by destination TCP port, enter dst port and the port. To filter by source port, src port and the port.
FortiGate防火墙抓包方法
作者:易隐者 发布于:2012-3-16 17:50 Friday 分类:参考资料
在使用后台抓包分析命令时,建议大家使用如SecureCRT 这样的远程管理工具,通过telnet 或者ssh 的方式登陆到网关,由于UTM 本身不支持将抓包的结果保存在设备自身的存储空间,因此需要借助SecureCRT 这样远程管理工具接收文件
基本命令
命令: diagnose sniffer packet.
# diag sniffer packet <interface> <'filter'> <verbose> <count>
参数说明
1, interface
<interface> 指定实际的接口名称,可以是真实的物理接口名称,也可以是VLAN 的逻辑接口名称,当使用“any”关键字时,表示抓全部接口的数据包。
例:
#diag sniffer packet port1 //表示抓物理接口为port1 的所有数据包
#diag sniffer packet any //表示抓所有接口的所有数据包
#diag sniffer packet port1-v10 //当在物理接口建立一个VLAN 子接口,其逻辑接口名为port1-v10,此时表示抓port1-v10 接口的所有数据包,此处一定注意一个问题,由于抓包命令中的空格使用来区分参数字段的,但是在逻辑接口创建时,接口名称支持空格,考虑到今后抓包分析的方便,建议在创建逻辑接口时不要带有空格。
2, verbose
<verbose> 指控制抓取数据包的内容
1: print header of packets, //只抓取IP的原地址、源端口、目的地址、目的端口和数据包的Sequence numbers 为系统缺省设置
2: print header and data from ip of packets, //抓取IP数据包的详细信息,包括IP数据的payload。
3: print header and data from ethernet of packets) ,//抓取IP数据包的详细信息,包括IP数据的payload,导出到文本文件可以使有专用的转换工具,转换为Ethereal支持文件格式
例:
【例1】 抓所有接口(interface=any)的任何数据包(filter=none),级别1
(verbose=1)
FG-UTM # dia sni pa any none 1
interfaces=[any]
filters=[none]
nr=2048,fr=1584,b_nr=1024,pg=4096
3.710103 127.0.0.1.1029 -> 127.0.0.1.53: udp 40
【例2】 抓所有接口(interface=any)的任何数据包(filter=none),级别2
(verbose=2),会显示数据包的payload信息。
# diag sniffer packet internal none 2 1
192.168.0.1.22 -> 192.168.0.30.1144: psh 2867817048 ack 1951061933
0x0000 4510 005c 8eb1 4000 4006 2a6b c0a8 0001 E..\..@.@.*k....
0x0010 c0a8 001e 0016 0478 aaef 6a58 744a d7ad .......x..jXtJ..
0x0020 5018 0b5c 8ab9 0000 9819 880b f465 62a8 P..\.........eb.
0x0030 3eaf 3804 3fee 2555 8deb 24da dd0d c684 >.8.?.%U..$.....
0x0040 08a9 7907 202d 5898 a85c facb 8c0a f9e5 ..y..-X..\......
0x0050 bd9c b649 5318 7fc5 c415 5a59 ...IS.....ZY
【例3】 抓所有接口(interface=any)的任何数据包(filter=none),级别3(verbose=3),会显示数据包的payload信息。
FG-UTM # dia sni pa any none 3
interfaces=[any]
filters=[none]
nr=2048,fr=1584,b_nr=1024,pg=4096
3.770099 127.0.0.1.1029 -> 127.0.0.1.53: udp 40
0x0000 0004 0304 0000 0000 9200 0000 2a00 0800
3, count
<count> 指使有抓包命令抓取的数据包的数量
例:
# diag sniffer packet internal none 1 3
192.168.0.30.1156 -> 192.168.0.1.80: syn 2164883624
192.168.0.1.80 -> 192.168.0.30.1156: syn 3792179542 ack 2164883625
192.168.0.30.1156 -> 192.168.0.1.80: ack 3792179543
说明:抓取internal 接口,不使有任何过滤器(及none)级别为1,抓取3个数据包。此处,注意“none”必须要,代表过滤器的类型;注意“1”必须要,否则系统会自动识别为<verbose>参数。
4, filter
<filter> 抓包文件过滤器
语法: '[[src|dst] host<host_name_or_IP1>] [[src|dst]
host<host_name_or_IP2>] [[arp|ip|gre|esp|udp|tcp] [port_num]]
[[arp|ip|gre|esp|udp|tcp] [port_num]]'
此处一定注意任何过滤语法必须使用单引号包含,否则会有问题。
第二种简单语法,适用于主机的会话抓包,无源和目的地址之分
'udp and port 1812 and host client1 and \( client2 or client3 \)'
【例1】使用源地址和目的地址过滤抓包
# diag sniffer packet internal 'src host 192.168.0.130 and dst
host 192.168.0.1' 1
192.168.0.130.3426 -> 192.168.0.1.80: syn 1325244087
192.168.0.1.80 -> 192.168.0.130.3426: syn 3483111189 ack 1325244088
192.168.0.130.3426 -> 192.168.0.1.80: ack 3483111190
192.168.0.130.3426 -> 192.168.0.1.80: psh 1325244088 ack 3483111190
192.168.0.1.80 -> 192.168.0.130.3426: ack 1325244686
192.168.0.130.1035 -> 192.168.0.1.53: udp 26
192.168.0.130.1035 -> 192.168.0.1.53: udp 42
192.168.0.130.1035 -> 192.168.0.1.53: udp 42
192.168.0.130 -> 192.168.0.1: icmp: echo request
192.168.0.130.3426 -> 192.168.0.1.80: psh 1325244686 ack 3483111190
192.168.0.1.80 -> 192.168.0.130.3426: ack 1325244735
192.168.0.130 -> 192.168.0.1: icmp: echo request
【例2】使用源地址和目的地址、以及TCP 关键词过滤抓两个地址间的TCP 流量
# diag sniffer packet internal 'src host 192.168.0.130 and dst host
192.168.0.1 and tcp' 1
192.168.0.130.3569 -> 192.168.0.1.23: syn 1802541497
192.168.0.1.23 -> 192.168.0.130.3569: syn 4238146022 ack 1802541498
192.168.0.130.3569 -> 192.168.0.1.23: ack 4238146023
【例3】使用地址(含源地址和目的地址)、以及ICMP 关键词过滤抓某个地址间的ICMP 流量
# diag sniffer packet internal 'host 192.168.0.130 and icmp' 1
192.168.0.130 -> 192.168.0.1: icmp: echo request
192.168.0.1 -> 192.168.0.130: icmp: echo reply
【例4】使用ICMP 关键词抓所有地址间的ICMP 流量
FG-UTM # diagnose sniffer packet port8 'icmp'
0.340847 10.7.10.100 -> 10.7.10.1: icmp: echo request
0.340869 10.7.10.1 -> 10.7.10.100: icmp: echo reply
1.340982 10.7.10.100 -> 10.7.10.1: icmp: echo request
1.340997 10.7.10.1 -> 10.7.10.100: icmp: echo reply
【例5】使用地址(含源地址和目的地址)、以及TCP 的端口关键词过滤抓两个地址间的TCP 对应端口流量
# diag sniffer packet internal 'host 192.168.0.130 or host 192.168.0.1
and tcp and port 80' 1
192.168.0.130.3625 -> 192.168.0.1.80: syn 2057246590
192.168.0.1.80 -> 192.168.0.130.3625: syn 3291168205 ack 2057246591
192.168.0.130.3625 -> 192.168.0.1.80: ack 3291168206
192.168.0.130.3625 -> 192.168.0.1.80: psh 2057246591 ack 3291168206
192.168.0.1.80 -> 192.168.0.130.3625: ack 2057247265
【例6】使用接口、以及TCP 的端口关键词过滤抓多个地址间的TCP 非对应端口流量,下例为不抓取23 端口的TCP 流量
FG-UTM # diagnose sniffer packet any 'tcp and port !23'
interfaces=[any]
filters=[tcp and port !23]
nr=8192,fr=1680,b_nr=4096,pg=4096
9.323698 10.7.10.100.1853 -> 10.7.10.1.443: syn 4042810565
9.323786 10.7.10.1.443 -> 10.7.10.100.1853: syn 177080791 ack 4042810566
9.324070 10.7.10.100.1853 -> 10.7.10.1.443: ack 177080792
9.326695 10.7.10.100.1853 -> 10.7.10.1.443: psh 4042810566 ack 177080792
9.326765 10.7.10.1.443 -> 10.7.10.100.1853: ack 4042810644
【例7】使用接口、以及IP 的协议端口proto 关键词过滤抓多个地址间的IP层对应端口流量,下例为抓取IP 层协议号为 1 的及ICMP 的流量
FG-UTM # diagnose sniffer packet port8 'ip proto 1'
interfaces=[port8]
filters=[ip proto 1]
nr=8192,fr=1664,b_nr=4096,pg=4096
5.701978 10.7.10.100 -> 10.7.10.1: icmp: echo request
5.702056 10.7.10.1 -> 10.7.10.100: icmp: echo reply
6.694490 10.7.10.100 -> 10.7.10.1: icmp: echo request
使用转化工具的方法
首先,由于UTM 自身不支持抓包信息的存储,必须使有其他工具进行抓包信息的收集,本文档使有SecureCRT 进行文本收集。
其次,使用抓包命令的<verbose>级别为3,此时导出的文件才能被ethereal识别。
第三,要获取大量信息时,使有SecureCRT 工具应该通过远程数据连接(telnet或者时SSH 方式,使用主机串口工作在这种模式下,由于串口速率的问题,无法获得大量数据。
第四,使用单独提供的文件进行转换,主机必须提前perl 的解释程序和Ethereal 软件,并在提供的转换使用的脚本文件中做必要的路径指向。
1, SecureCRT 的配置
正常安装SecureCRT 软件,并通过远程方式登陆到UTM 网关。
1、配置:文件接收――工具栏――Transfer――Receive ASCII
2、选择配置文件存储的路径,文件格式为*.txt
执行抓包命令:
FG-UTM # diagnose sniffer packet any none 3
其中3 代表抓包的输出文件支持经过转换为Ethereal 格式文件。
2, 编辑使用的脚本文件
编辑提供的转换文件脚本fgt2eth.pl,修改脚本的第59 行,此处需要指明Ethereal 的安装路径,下例中Ethereal 抓包分析软件安装在D 分区的根目录的Ethereal 目录下,只需要指明安装目录即可,注意使用\\
第65 行:my $text2pcapdirwin = "d:\\Ethereal";
转换文件脚本fgt2eth.pl 请参考本文档『附录』,注意一定要进行必要的编辑。
3, 转换操作
1、首先正常安装Perl 解释器,本例使用的是ActivePerl 5.8.8 Build 819 版本的perl 语言工具。(工具可以自己从网上下载)
2、在DOS 命令行执行
C:\>perl D:\ fgt2eth.pl -in D:\packet
[转换脚本文件的路径和文件名] [输入参数] [输入抓包获取的文件名]
缺省的输出文件与输入的相同路径下。
C:\>perl D:\fgt2eth.pl -in D:\packet
Conversion of file D:\packet phase 1 (FG verbose 3 conversion)
Output written to D:\packet.eth.
Conversion of file D:\packet phase 2 (windows text2pcap)
Ouput file to load in Ethereal is 'D:\packet.eth'
上例显示,转换成功,转化输出的文件在D 分区下,转换生成的文件为packet.eth'。
如果需要改变输出的文件名,执行命令:
C:\>perl D:\ fgt2eth.pl -in D:\packet –out D:\[输出文件名]
3、使用Ethereal 打开生成的转换文件
上图显示生成的文件可以正常打开,并使用Ethereal 工具分析。
-
QQ邮箱订阅

-
搜索
日历
最新日志
链接
分类

最新碎语
- 如果一个人想要做一件真正忠于自己内心的事情,那么往往只能一个人独自去做"——理查德·耶茨
2019-06-25 21:34
- 日后我们知道,真正的人生道路是由内心决定的。不论我们的道路看上去如此曲折、如此荒谬地背离我们的愿望,它终归还是把我们引到我们看不见的目的地。(茨威格《昨日世界》)
2019-03-16 21:27
- 如果你渴望得到某样东西,你得让它自由,如果它回到你身边,它就是属于你的,如果它不会回来,你就从未拥有过它。——大仲马《基督山伯爵》
2018-10-09 22:07
- 人生有两大悲剧:一个是没有得到你心爱的东西;另一个是得到了你心爱的东西。人生有两大快乐:一个是没有得到你心爱的东西,于是可以寻求和创造;另一个是得到了你心爱的东西,于是可以去品味和体验。——弗洛伊德
2018-09-25 18:06
- 一个人越有思想,发现有个性的人就越多。普通人是看不出人与人之间的差别的——布莱兹·帕斯卡尔
2018-08-30 18:44
存档
- 2020年11月(2)
- 2018年1月(1)
- 2017年12月(1)
- 2017年11月(6)
- 2017年6月(1)
- 2017年5月(1)
- 2017年4月(1)
- 2017年3月(1)
- 2016年11月(1)
- 2016年4月(1)
- 2015年7月(2)
- 2015年6月(1)
- 2015年5月(5)
- 2014年12月(1)
- 2014年11月(1)
- 2014年10月(1)
- 2014年8月(1)
- 2014年7月(1)
- 2014年6月(1)
- 2014年5月(1)
- 2014年4月(3)
- 2014年2月(2)
- 2014年1月(2)
- 2013年12月(1)
- 2013年11月(1)
- 2013年10月(2)
- 2013年9月(1)
- 2013年8月(1)
- 2013年7月(3)
- 2013年6月(2)
- 2013年5月(1)
- 2013年4月(3)
- 2013年3月(1)
- 2013年2月(2)
- 2013年1月(2)
- 2012年12月(11)
- 2012年11月(12)
- 2012年10月(12)
- 2012年9月(26)
- 2012年8月(29)
- 2012年7月(18)
- 2012年6月(2)
- 2012年5月(25)
- 2012年4月(16)
- 2012年3月(13)
- 2012年2月(6)
标签
blogger