ROS软路由抓包方法
作者:易隐者 发布于:2012-3-16 17:50 Friday 分类:参考资料
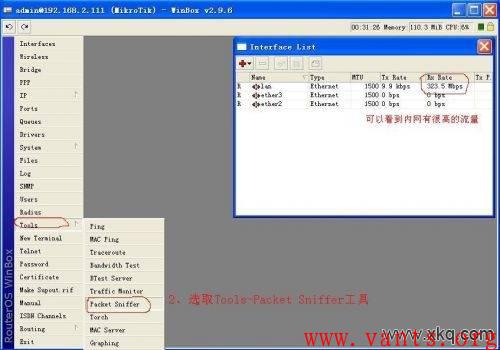
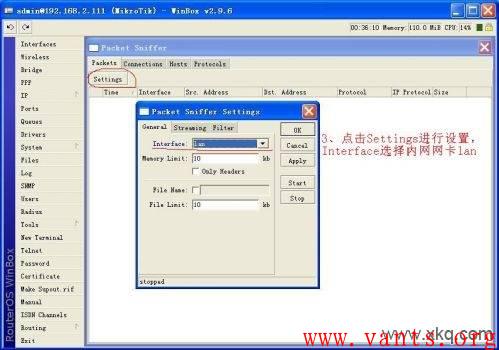
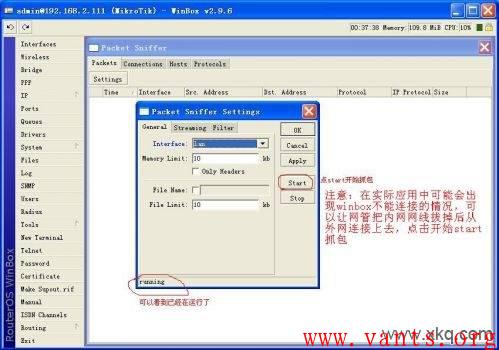
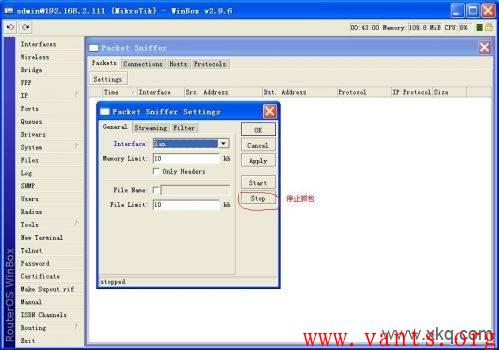
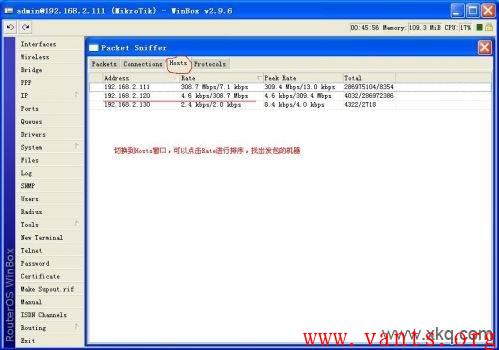
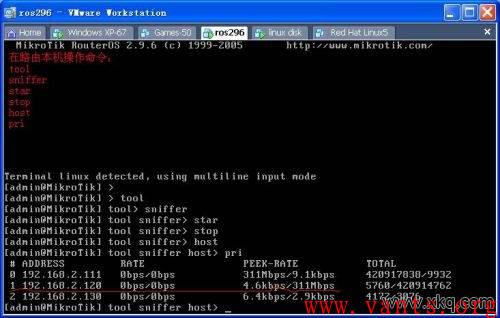
ROS软路由本身是有抓包功能
在管理界面中,进入“TOOL->Packet Sniffer”,如下图:
深信服上网行为管理网关抓包方法
作者:易隐者 发布于:2012-3-16 17:49 Friday 分类:参考资料
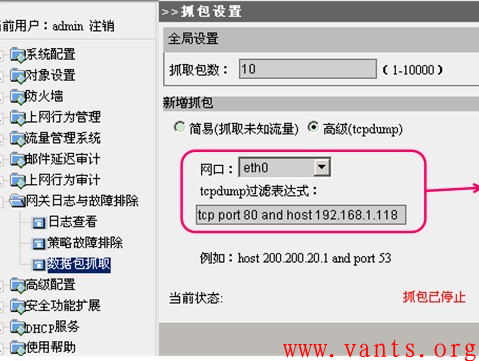
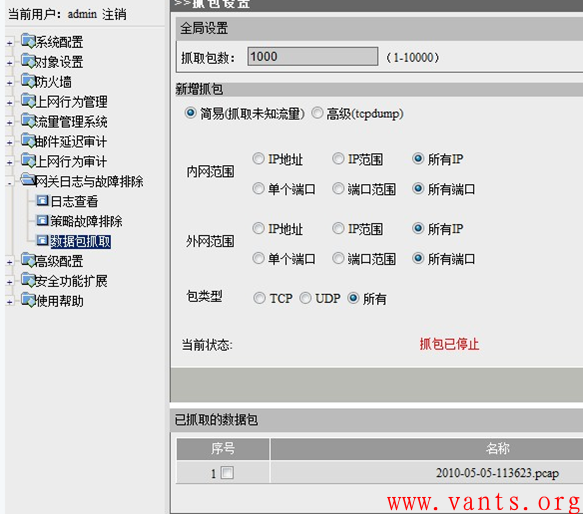
深信服是主流的上网行为管理网关,在用户的网络环境中比较常见,而且这种设备会对进出的数据报文做深层的处理,因此往往是导致网络故障的可疑点之一,我们可以利用深信服设备自带的抓包功能实现对设备进出口数据包的捕获。
1,在深信服管理界面里,“日志与故障排除”->“数据包抓取”目录下,我们可以设置捕包的条件,如下图所示:
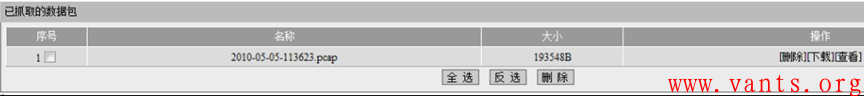
2,捕包完成后,我们可以下载下来用科来或者wireshark打开进行分析,下载下来的格式为.pcap格式。下载的路径为:“网关日志与故障排除”->“数据包抓取”->“已抓取的数据包”->“下载”,图示如下:
联想网御防火墙抓包方法
作者:易隐者 发布于:2012-3-16 17:49 Friday 分类:参考资料
网御防火墙也带有tcpdump抓包功能,网御防火墙使用tcpdump需要使用root登录。
登录用户名为:root
密码为:g8#6vod3
关于tcpdump使用的方法参见linux的《tcpdump的使用手册》。
WEBUI图形化界面的方式
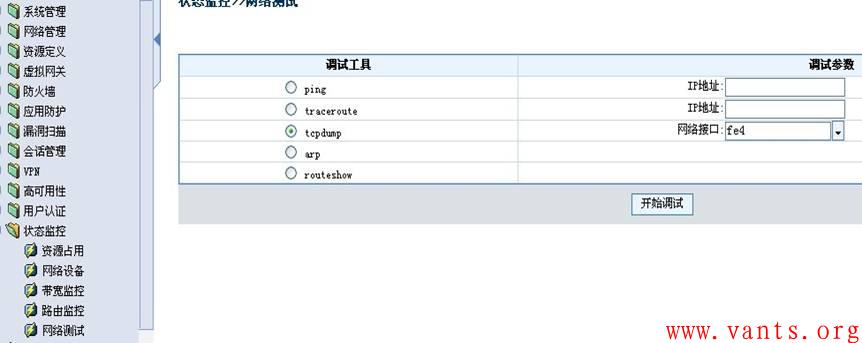
在WEBUI图形化界面中进行抓包相对比较简单,在“状态检测”->“网络测试”中,有“tcpdump”选项,但是只能指定接口来抓包,如下图示:
命令行方式
通过串口、ssh或者telnet的方式登录防火墙。
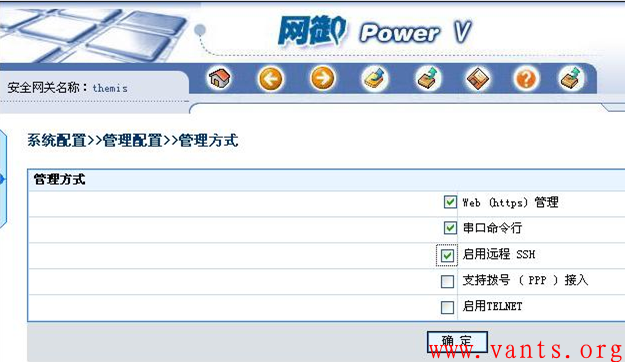
1,首先需要在防火墙上先要开启相应的管理权限,如下图所示:
2,用户名密码使用dump这是一个专门的抓报用户名。也可以用管理员登录的身份进行抓包,用户名与密码:administrator 或者是用户名:administrator 密码:leadsec@7766 ,不同的版本密码不一样。
3,tcpdump的使用说明和案例
tcpdump -i eth0 -c 1000 –s 0 –w eth0.cap (注:物理设备显示或者WEBUI界面显示的接口名称为FEX表示,而抓包时是以ETHY显示,Y为X-1)
-c 1000 代表抓1000个包,-s 0 代表抓完整的数据包(可省略) -w 代表写入dom ,文件名后坠cap
例如:抓来自192.168.100.77的包,用命令
tcpdump -i eth1 -n host 192.168.100.77 -c 1000 –s 0 –w eth0.cap
-n表示不解析域名
例如:抓来自端口号为9998的包,用命令
tcpdump -i eth1 port 9998 -c 1000 –s 0 –w eth0.cap
例如:抓来自vpn内的包,用命令
tcpdump -i ipsec -c 1000 –s 0 –w eth0.cap
第二步、上传抓包
使用sz eth0.cap命令可以将第一步所抓的包上传到SecureCRT软件安装的目录下的一个download的子目录里,文件名为eth0.cap,用ethereal可以打开这个文件。
dump>sz eth0.cap
第三步、清除抓包文件 ,这个步骤一定要做
用命令rm eth0.cap文件可以清空用tcpdump抓的包
Juniper防火墙下抓包方法
作者:易隐者 发布于:2012-3-16 17:44 Friday 分类:参考资料
debug flow basic
相对于其他防火墙而言,Juniper防火墙提供许多有效的查错工具,其中之一就是debug flow basic, 应用方式举例如下:
1. 先设置过滤列表,使得防火墙只对需要的数据包进行分析. 即set ffilter命令:
ns208-> set ffilter ?
dst-ip flow filter dst ip
dst-port flow filter dst port
ip-proto flow filter ip proto
src-ip flow filter src ip
src-port flow filter src port
=DBtZ|~4f@
ns208-> set ffilter src-ip 192.168.1.10
filter added
ns208-> get ff
Flow filter based on:
id:0 src ip 192.168.1.10
ns208-> set ffilter src-ip 192.168.1.11
filter added
ns208-> get ff
Flow filter based on:
id:0 src ip 192.168.1.10
id:1 src ip 192.168.1.11
看出来了吗? 设置两次ffilter的结果是两个过滤列表之间是OR的关系. 如果直接设
set ffilter src-ip 192.168.1.11 dst-ip 194.73.82.242 就是AND的关系了.
2. 开启debug
ns208-> debug flow basic
3. 发送测试数据包或让小部分流量穿越防火墙
4. 停止debug
ns208-> undebug all
5. 检查防火墙对所转发的符合过滤条件的数据包的分析结果: }
ns208-> get db stream
****** 12553.0: packet received [60]****** Packet arrived on the eth1 interface tF(UJO xk
ipid = 29503(733f), @d7806910 IP id
packet passed sanity check. I rbyB6. ¬
ethernet1:192.168.1.10/1280->194.73.82.242/512,1(8/0) Src IP, Port, Dst IP, port incl Protocol 1
chose interface ethernet1 as incoming nat if. Int eth1 is placed in NAT mode s<`Nxz@0
search route to (192.168.1.10->194.73.82.242) in vr trust-vr for vsd-0/flag-0/ifp-null Route lookup in trust-vr
route 194.73.82.242->1.1.1.2, to ethernet3 route found to gateway 1.1.1.2 exiting interface int eth3
routed (194.73.82.242, 0.0.0.0) from ethernet1 (ethernet1 in 0) to ethernet3 packet routed
policy search from zone 2-> zone 1 Policy lookup performed from Trust (2) to Untrust (1)
Permitted by policy 3 matched policy ID 3
choose interface ethernet3 as outgoing phy if choose physical interface eth3
no loop on ifp ethernet3. r4Ok(8f6¬D
session application type 0, name None, timeout 60sec session time created as 60 seconds for ICMP
service lookup identified service 0. service lookup performed
existing vector list 1-559ef00.
Session (id:76) created for first pak 1 Create session with ID 76
route to 1.1.1.2 Routed packet to 1.1.1.2
arp entry found for 1.1.1.2 Already had ARP entry for 1.1.1.2
nsp2 wing prepared, ready
cache mac in the session Cached MAC address in the session
flow got session.
flow session id 76
post addr xlation: 1.1.1.1->194.73.82.242. Translate src address to egress interface IP
packet send out to 0010db103041 through ethernet3 Packet sent out on the wire
6. 清除防火墙缓存的debug结果:
ns208-> clear db
7. 清除防火墙的过滤设置
ns208->unset ffilter 0
ns208->get ffilter
Snoop
Snoop 是Juniper防火墙另外一个有效的查错工具,它和debug flow basic的区别是: snoop类似于在防火墙的接口上抓包,可以根据具体接口, 数据包的方向, 协议等等要素进行过滤抓包; debug flow basic则对数据包如何穿越防火墙进行分析,将防火墙的对数据包的处理过程显示出来. Snoop的使用举例如下: 1. 先设置过滤列表,使得防火墙只对需要的数据包进行分析. 即snoop filter命令:
ns208-> snoop filterdelete delete snoop filter >
ethernet snoop specified ethernet
id snoop filter id |
ip snoop ip packet ?YcG
off turn off snoop filter dwjYU\on turn on snoop filter
tcp snoop tcp packet udp snoop udp packet 7
ns208-> snoop filter ip
direction snoop direction
dst-ip snoop filter dst ip dst-port snoop filter dst port
interface interface name
ip-proto snoop filter ip proto a port src or dst port Pv
src-ip snoop filter src ip 1)TEIsrc-port snoop filter src port
IPv4 Address
offset ip offset UqDqF
ns208-> snoop info
Snoop: OFF
Filters Defined: 2, Active Filters 2
Detail: OFF, Detail Display length: 96 EE
Snoop filter based on: id 1(on): IP dir(I) qc
id 2(on): IP dst-ip 172.27.68.1 dir(B) :WdL
RHtx3{S/
2. 开启snoop 进行抓包 YC
ns208-> snoopStart Snoop, type ESC or 'snoop off' to stop, continue? [y]/n y
3. 发送测试数据包或让小部分流量穿越防火墙
4. 停止snoop ns208-> snoop off
5. 检查防火墙对所转发的符合过滤条件的数据包的分析结果(非采用上面的filter,而是采用另外的filter):
ns208-> get db stream 5Y =M <ZEC&NBSP; q#I>m¬u=JJ
1. The packet comes into the Netscreen from the Trusted side client. 55864.0: 0(i):005004bb815f->0010db00ab30/0800 D *MoEd
10.0.0.36->10.10.10.14/1, tlen=60 vhl=45, id=31489, frag=0000, ttl=32
2. The packet then leaves the Netscreen, on it’s way to the destination host. 55864.0: 1(o):0010db00ab31->00104bf3d073/0800 10.10.10.10->10.10.10.14/1, tlen=60 uS
vhl=45, id=31489, frag=0000, ttl=31 r
3. The packet then returns to the Netscreen from the host. &W 55864.0: 1(i):00104bf3d073->0010db00ab31/0800 |_+% 'XtU
10.10.10.14->10.10.10.10/1, tlen=60 |yxLm vhl=45, id=12289, frag=0000, ttl=128
4. Finally, the packet is returned to the client on the trusted side. -
55864.0: 0(o):0010db00ab30->005004bb815f/0800 4 /W|~=y 10.10.10.14->10.0.0.36/1, tlen=60
vhl=45, id=12289, frag=0000, ttl=127 6,19usXw:M
6. 清除防火墙缓存的debug结果:ns208-> clear db W7. 清除防火墙的snoop过滤设置
ns208-> snoop filter delete
All filters removed
标签: debug 防火墙 抓包 Juniper snoop
HP-UX系统下的抓包工具——tcpdump与nettl
作者:易隐者 发布于:2012-3-16 17:39 Friday 分类:参考资料
HP-UX上使用tcpdump抓包的方法
1.检查是否有tcpdump软件,如果没有则安装tcpdump软件,软件在hpl3000上有
2.抓包
# netstat -in看现在用的是那个网卡,假如用的是lan0
# tcpdump -i lan0 -w /tmp/lan0.tcpdump.log -x -vv 'tcp port 53'
运行一段时间后按^C中断
注意:运行过程要监控一下/tmp的使用率,如果/tmp上升得太快则需要马上中断抓包进程。
3.格式化包输出
# tcpdump -nq -r /tmp/lan0.tcpdump.log.bak > /tmp/output.tcpdump.log
然后把/tmp/output.tcpdump.log提供出来就可以
HP-UX上用nettl抓包
HP-UX 自己提供了抓包工具,nettl 。在tcpdump不能用的时候它(比如tcpdump在HP-UX上就不能抓回环上的包)就派上用场了。总结一下nettl的主要用法,备查。
开始抓包:
# nettl -tn all -e all -maxtrace 99999 -f /tmp/tixiang
# nettl -tn loopback -e ns_ls_tcp -maxtrace 99999 -f /tmp/tixiang
# nettl -tn pduin pduout -e ns_ls_loopback -tm 100000 -f /tmp/local
# nettl -tn pduin pduout -e ns_ls_loopback -m 56 -tm 100000 -f /tmp/local
# nettl -tn pduin -e ns_ls_loopback -m 56 -tm 100000 -f /tmp/local
-m size 限制每个包的大小。我们不一定对所有的包都感兴趣,在只对包头感兴趣的时候这个选项就非常有效。
FDB协议使用的包头为16个字节,再加上IP头的20个字节,TCP头的20个字节,也就是我们只需要总共56个字节就能确定一个包的基本信息了。
-e subsytem 要抓包的类型,可以使用 nettl -status 来获取。
ns_ls_loopback
ns_ls_ip
ns_ls_tcp
ns_ls_udp
ns_ls_icmp
-tm maxsize 每个文件的最大大小,如果超过此大小,会使用下一个抓包文件。单位:KB。有效值:100~99999
抓包的输出文件为 /tmp/tixiang.xxxx,使用 ls -l /tmp/tixiang.* 来检查
说明:
在 ns_ls_loopback 上抓包如果指定了pduin 和 pduout 每个包会抓到2份,因为一进一出就是两份。
如果指定 -tn all -e all 一个包也会抓到多份,因为一个包可能属于不同的 subsystem,比如一个tcp包既属于tcp,也属于ip等。
抓的包可以使用wireshark来打开并进行分析。也可以使用HP-UX自带的netfmt来分析。
查看状态及-entity可用的信息:
# nettl -status
停止抓包:
# nettl -tf -e all
对包的分析
我们可以使用netfmt来查看捕获的包:
netfmt -N -l -f /tmp/nettl_t* | more
可以过滤我们感兴趣的包,使用 -c 来传入过滤文件
netfmt -N -l -c filter -f /tmp/nettl_t* | more
filter 为过滤文件,文件内容的类似如下:
filter tcp_sport 1234
filter tcp_dport 1234
每一行为一个过滤条件,行与行之间是或的关系。
使用行模式来显示(这种模式下不会看到包的具体数据)
netfmt -N -n -l -1 -f /tmp/nettl_t* | more
在每行的显示前加上时间戳
netfmt -T -n -l -1 -f /tmp/nettl_t* | more
参考:
http://www.compute-aid.com/nettl.html
http://docs.hp.com/en/B2355-60105/nettl.1M.html
http://docs.hp.com/en/B2355-60105/netfmt.1M.html
本文章源自网络,原始出处和作者信息请访问如下链接:
http://chenm.blogbus.com/logs/52906888.html
-
QQ邮箱订阅

-
搜索
日历
最新日志
链接
分类

最新碎语
- 如果一个人想要做一件真正忠于自己内心的事情,那么往往只能一个人独自去做"——理查德·耶茨
2019-06-25 21:34
- 日后我们知道,真正的人生道路是由内心决定的。不论我们的道路看上去如此曲折、如此荒谬地背离我们的愿望,它终归还是把我们引到我们看不见的目的地。(茨威格《昨日世界》)
2019-03-16 21:27
- 如果你渴望得到某样东西,你得让它自由,如果它回到你身边,它就是属于你的,如果它不会回来,你就从未拥有过它。——大仲马《基督山伯爵》
2018-10-09 22:07
- 人生有两大悲剧:一个是没有得到你心爱的东西;另一个是得到了你心爱的东西。人生有两大快乐:一个是没有得到你心爱的东西,于是可以寻求和创造;另一个是得到了你心爱的东西,于是可以去品味和体验。——弗洛伊德
2018-09-25 18:06
- 一个人越有思想,发现有个性的人就越多。普通人是看不出人与人之间的差别的——布莱兹·帕斯卡尔
2018-08-30 18:44
存档
- 2020年11月(2)
- 2018年1月(1)
- 2017年12月(1)
- 2017年11月(6)
- 2017年6月(1)
- 2017年5月(1)
- 2017年4月(1)
- 2017年3月(1)
- 2016年11月(1)
- 2016年4月(1)
- 2015年7月(2)
- 2015年6月(1)
- 2015年5月(5)
- 2014年12月(1)
- 2014年11月(1)
- 2014年10月(1)
- 2014年8月(1)
- 2014年7月(1)
- 2014年6月(1)
- 2014年5月(1)
- 2014年4月(3)
- 2014年2月(2)
- 2014年1月(2)
- 2013年12月(1)
- 2013年11月(1)
- 2013年10月(2)
- 2013年9月(1)
- 2013年8月(1)
- 2013年7月(3)
- 2013年6月(2)
- 2013年5月(1)
- 2013年4月(3)
- 2013年3月(1)
- 2013年2月(2)
- 2013年1月(2)
- 2012年12月(11)
- 2012年11月(12)
- 2012年10月(12)
- 2012年9月(26)
- 2012年8月(29)
- 2012年7月(18)
- 2012年6月(2)
- 2012年5月(25)
- 2012年4月(16)
- 2012年3月(13)
- 2012年2月(6)
标签
blogger